Data Science and the Notebook
Abstract
Data science is statistics done by people who write code, and its history is mostly a history of tools. John Tukey asked in 1962 for a science of “data analysis” separate from mathematical statistics; the name “data science” was proposed several times after that and stuck only around 2008, when Facebook and LinkedIn needed a job title for the people mining their user logs. What made the job possible for hundreds of thousands of people was a stack of free Python software: NumPy’s arrays (2006), Wes McKinney’s pandas DataFrame (2008), scikit-learn (2010), and Fernando Pérez’s IPython, which grew in 2011 into a browser notebook and in 2014 into Project Jupyter. The notebook mixed code, text and plots in one document and became the default workbench of the field. It also made it easy to publish results nobody could rerun: a 2019 study re-executed 863,878 notebooks from GitHub and found that 4 percent reproduced their own stored output.
Tukey’s Complaint
In 1962 John Tukey, the Princeton and Bell Labs statistician who had given computing the word “bit” and co-authored the fast Fourier transform, published “The Future of Data Analysis” in the Annals of Mathematical Statistics. It opened with a confession: “For a long time I have thought I was a statistician, interested in inferences from the particular to the general. But as I have watched mathematical statistics evolve, I have had cause to wonder and to doubt.” His “central interest”, he decided, was data analysis: how to gather data, look at it, and interpret what the procedures said. Fifteen years later his book Exploratory Data Analysis (1977) introduced the box plot and argued for looking at data before testing hypotheses about it.
The name came later and more than once. Peter Naur, who had already renamed computer science “datalogi” in Denmark, used “data science” in his Concise Survey of Computer Methods of 1974. The statistician C. F. Jeff Wu proposed it as a new name for statistics in a Beijing lecture in 1985 and again in 1997. William Cleveland published an action plan for a field called “data science” in 2001, the same year Leo Breiman’s paper “Statistical Modeling: The Two Cultures” told statisticians that the people getting results were the ones who cared about prediction rather than inference. None of these made the word popular. Industry did.
A Job Title
In 2008 Jeff Hammerbacher at Facebook and DJ Patil at LinkedIn were building teams of people who combined programming, statistics and product sense, and settled on “data scientist” as a title (the story is told in The Big Data Revolution). In October 2012 Patil and Thomas Davenport called it “The Sexiest Job of the 21st Century” in the Harvard Business Review, with LinkedIn’s “People You May Know” feature as the founding legend. Universities followed the job market. On 8 September 2015 the University of Michigan announced a $100 million Data Science Initiative with 35 new faculty positions; ten days later, at the centenary workshop for Tukey at Princeton, David Donoho gave a talk called “50 Years of Data Science” that pointed out how much of the new field was the old field Tukey had asked for, now hired by computer science departments rather than statistics departments.
Competitions
Much of the prediction culture Breiman described was built on public contests with a fixed dataset and a leaderboard. The Netflix Prize, announced on 2 October 2006, offered $1 million to anyone who beat the company’s Cinematch recommender by 10 percent on a set of more than 100 million ratings from about 480,000 customers. It took three years. BellKor’s Pragmatic Chaos won on 21 September 2009 with a 10.06 percent improvement; The Ensemble matched the score and lost because it had submitted twenty minutes later. Netflix then did not use the winning blend. Its engineers wrote in 2012 that “the additional accuracy gains that we measured did not seem to justify the engineering effort needed to bring them into a production environment”, and by then the company’s business had moved to streaming anyway. A planned second contest was cancelled in March 2010 after two researchers, Arvind Narayanan and Vitaly Shmatikov, showed that customers in the “anonymised” data could be identified by matching their ratings against public reviews, and after a class-action suit.
Kaggle, founded by Anthony Goldbloom in April 2010, turned the contest format into a business: companies posted datasets and prize money, and anyone could compete. Google bought it in March 2017, when its community counted “hundreds of thousands of data scientists”; it passed a million registered users that June.
The Python Stack
Statisticians of the 1990s worked in SAS, SPSS, Stata or R; engineers in MATLAB. Python entered the field through its numerical libraries. In 1995 a “matrix-sig” mailing list including van Rossum designed array support for the language, and Jim Hugunin and Jim Fulton wrote Numeric, borrowing ideas from APL, MATLAB and Fortran. A rival package, Numarray, split the community until Travis Oliphant merged the two into NumPy, released as 1.0 in 2006.
Wes McKinney started pandas in 2008 while working as a researcher at AQR Capital Management, a quantitative hedge fund, because he wanted to do in Python the kind of time-series and table manipulation analysts did in R and Excel. The name came from “panel data”, the econometrician’s term for observations of the same subjects over time. AQR let him release it as open source in 2009, and his book Python for Data Analysis (2012) became the field’s manual. Its central object, the DataFrame, a table of named, typed columns, was modelled on R’s data frame, which R had inherited from John Chambers’s S at Bell Labs.
Machine learning arrived in the same way. David Cournapeau started scikits.learn as a Google Summer of Code project in 2007; a team at the French research institute INRIA (Fabian Pedregosa, Gaël Varoquaux, Alexandre Gramfort and Vincent Michel) took it over and made the first public release of scikit-learn on 1 February 2010. Its uniform “fit and predict” interface made a random forest and a logistic regression interchangeable in a line of code.
The effect was visible in Stack Overflow’s traffic. David Robinson, a data scientist at the site, reported in September 2017 that pandas had “barely been introduced in 2011” and by then accounted for almost 1 percent of all question views, the fastest growth of any Python package, and that “the fastest-growing use of Python is for data science, machine learning and academic research.” R kept academic statistics; Python took most of industry.
The Notebook
Fernando Pérez was a graduate student at the University of Colorado Boulder in 2001 when he wrote the first IPython as, in his own later account, a thesis procrastination project: a 259-line script whose description read “Interactive execution with automatic history, tries to mimic Mathematica’s prompt system.” He merged it with two other enhanced Python shells, Janko Hauser’s IPP and Nathan Gray’s LazyPython, to get “shell-like features, IDL/Matlab numerics, Mathematica-type prompt history and great object introspection.”
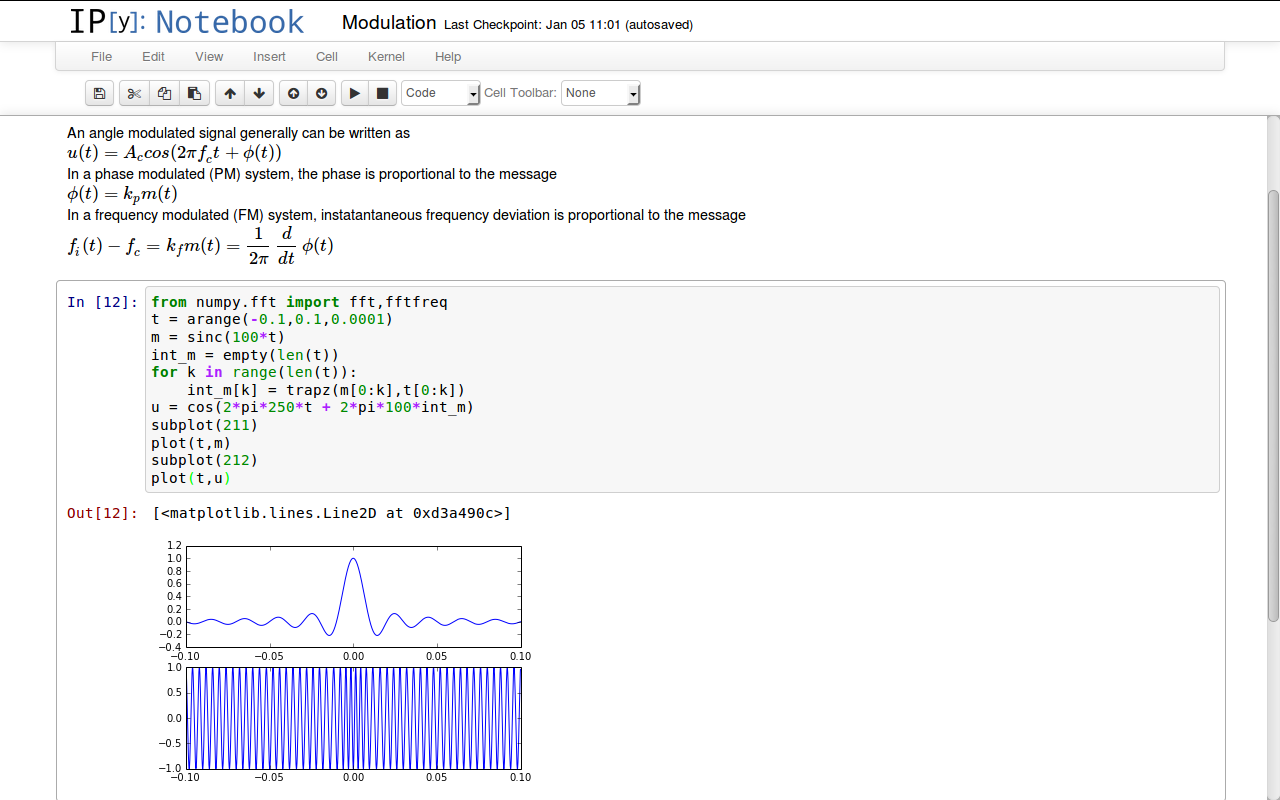
The model he was imitating was the notebook interface Theodore Gray had designed for Mathematica in 1988, in which text, formulas, input and output share one scrolling document. Pérez and Brian Granger, a physicist then at Santa Clara University, worked on a Python equivalent for years. The version that shipped ran in a web browser: IPython 0.12, released in December 2011 by a team including Pérez, Brian Granger and Min Ragan-Kelley, sent code from browser cells to a separate “kernel” process and put the results, including plots, back into the page. Because the kernel was a separate process speaking a documented protocol, the kernel did not have to be Python. In 2014 Pérez announced the language-independent part as Project Jupyter, named for Julia, Python and R, with a logo recalling the notebooks in which Galileo recorded the moons of Jupiter.
The notebook suited how analysis is done: load a table, look at it, try a transformation, plot, go back. Notebooks were also documents that could be emailed or rendered on GitHub, which counted about 200,000 of them in 2015 and nearly 10 million by January 2021. Among them were notebooks about the first observation of gravitational waves. The economist Paul Romer, explaining in April 2018 why he had moved his research from Mathematica to Jupyter, wrote that it did “a better job of delivering what Theodore Gray had in mind when he designed the Mathematica notebook” than Mathematica itself. The Jupyter steering committee received the ACM Software System Award for 2017.
Dead End: The Notebook as Proof
A notebook stores each cell’s output next to its code, which invites the reader to believe that the code produced the output. It need not have. Cells can be run in any order, re-run after edits, or deleted after they set a variable that later cells still use, so the state of the running kernel can differ from anything the saved file describes. The counter beside each cell, the “12” in In [12], records the order in which cells were last executed, and gaps and inversions in it are the visible trace of this hidden state.
In 2019 João Felipe Pimentel, Leonardo Murta, Vanessa Braganholo and Juliana Freire collected 1.4 million notebooks from GitHub and tried to re-execute the Python ones with an unambiguous execution order. Of 863,878 attempts, 24.11 percent ran to the end without an error and 4.03 percent produced the same results as those stored in the file. About 36 percent of the notebooks had cells whose stored order was not the order in which they had been run. The main causes of failure were missing libraries, hidden state and out-of-order execution, and data files that were not available. At JupyterCon in August 2018 Joel Grus of the Allen Institute for AI gave a talk called “I Don’t Like Notebooks” on the same point, arguing that notebooks taught beginners habits that ordinary scripts and tests would not allow.
The reply from the notebook community was tooling rather than retreat: execution-order linters (the 2019 authors wrote one, Julynter), services that rebuild a notebook’s environment from a repository, and reactive notebooks that re-run dependent cells automatically. The notebook stayed the working surface of the field; the claim that a notebook was itself reproducible research did not survive the measurement.
📚 Sources
- Tukey, John W., “The Future of Data Analysis”, Annals of Mathematical Statistics 33 (1), 1962 (quoted via Donoho)
- Donoho, David, “50 Years of Data Science”, Tukey Centennial workshop, Princeton, 18 September 2015 (Tukey’s confession, Chambers, Cleveland and Breiman, the Michigan $100M initiative with 35 faculty on 8 September 2015)
- Data science, Wikipedia (Naur 1974, Wu 1985 and 1997, Cleveland 2001, Hammerbacher and Patil 2008, Davenport and Patil 2012) and John Tukey, Wikipedia (“bit”, Exploratory Data Analysis 1977, box plot)
- Davenport, Thomas H. and DJ Patil, “Data Scientist: The Sexiest Job of the 21st Century”, Harvard Business Review, October 2012
- Netflix Prize, Wikipedia (2 October 2006, 100 million ratings, 480,000 users, 21 September 2009, 10.06 percent, the twenty-minute tie-break, Narayanan and Shmatikov, the December 2009 suit and March 2010 cancellation)
- Amatriain, Xavier and Justin Basilico, “Netflix Recommendations: Beyond the 5 stars (Part 1)”, Netflix Technology Blog, April 2012 (quotation via “Why $1m Netflix algorithm never went to production”, FlowingData and Techdirt)
- Kaggle, Wikipedia (April 2010, Goldbloom, Google acquisition 8 March 2017, a million users by June 2017) and “Google confirms its acquisition of data science community Kaggle”, TechCrunch, 8 March 2017
- NumPy, Wikipedia (matrix-sig 1995, Numeric, Numarray, Oliphant, NumPy 1.0 in 2006) and Harris, Charles R. et al., “Array programming with NumPy”, Nature 585, 2020
- pandas (software), Wikipedia (McKinney at AQR 2008, open-sourced 2009, “panel data”) and Python for Data Analysis, 3E, Preface (first edition October 2012)
- scikit-learn, Wikipedia (Cournapeau, Google Summer of Code 2007, INRIA team, first public release 1 February 2010)
- Robinson, David, “Why is Python Growing So Quickly?”, Stack Overflow Blog, 14 September 2017
- History, IPython documentation (Boulder 2001, IPP, LazyPython, the quoted design goals)
- IPython 0.12, IPython documentation (the browser notebook; a 4.5-month cycle after 0.11 of 31 July 2011) and Project Jupyter, EarthCube (the 259-line script, “thesis procrastination project”, Granger at Santa Clara, the 2014 co-founding)
- Romer, Paul, “Jupyter, Mathematica, and the Future of the Research Paper”, 13 April 2018, and Theodore Gray, Wikipedia
- Project Jupyter, Wikipedia (2011 notebook, Pérez, Granger, Ragan-Kelley, 2014 spin-off, name and logo, GitHub counts, LIGO, Romer, 2017 ACM Software System Award)
- Pimentel, João Felipe, Leonardo Murta, Vanessa Braganholo and Juliana Freire, “A Large-scale Study about Quality and Reproducibility of Jupyter Notebooks”, MSR 2019, doi:10.1109/MSR.2019.00077 (1.4 million notebooks, 863,878 attempts, 24.11 and 4.03 percent, 36 percent out of order, causes of failure)
- Grus, Joel, “I don’t like notebooks.”, JupyterCon, New York, August 2018
- Image: IPython-notebook.png by Shishirdasika (CC BY-SA 3.0), via Wikimedia Commons