Network Science and the Small World
Abstract
In 1967 the social psychologist Stanley Milgram mailed folders to strangers in Nebraska and asked them to get each one to a stockbroker in Massachusetts through people they knew by first name. The chains that arrived had passed through about five intermediaries, and “six degrees of separation” entered the language. Thirty years later two mathematicians at Cornell showed why a world can be both cliquish and small, and a physicist at Notre Dame measured the web and found hubs that no textbook random graph produced. Together these papers started network science, the study of real networks (friendships, power grids, hyperlinks, neurons) as graphs with measurable structure. Its founding numbers turned out to be shakier than their fame: most of Milgram’s chains never arrived, and the “scale-free” networks said to be everywhere proved, in a 2019 test of nearly a thousand networks, to be rare.
Chain-Links
The idea arrived as fiction. In 1929 the Hungarian writer Frigyes Karinthy published a short story, “Láncszemek” (“Chain-Links”), in a collection titled Minden másképpen van (Everything Is Different). A character bets his companions that he can reach any of the Earth’s 1.5 billion people through no more than five individuals, one of whom he knows personally. He reaches the Nobel laureate Selma Lagerlöf in two links; the narrator then links himself to an anonymous riveter at the Ford Motor Company in four.
The mathematics came from graph theory, which had studied connections since Euler’s bridges of Königsberg but had little to say about networks nobody designed. In 1959 Paul Erdős and Alfréd Rényi in Budapest, and independently Edgar Gilbert at Bell Labs, defined the random graph: take n points and connect each pair with the same small probability. In a paper the next year Erdős and Rényi showed that such a graph changes suddenly as edges are added. Below an average of one link per node it is dust; just above that, one giant connected component appears. Random graphs have short paths, because the number of people reachable in k steps grows exponentially. They also predict that everyone has roughly the same number of links, with the counts following a Poisson distribution.
In the 1950s the political scientist Ithiel de Sola Pool and the mathematician Manfred Kochen worked out estimates of how many acquaintances a person has and how short the chains between Americans should be. Their manuscript, “Contacts and Influence”, circulated for two decades before it was published in the first issue of the journal Social Networks in 1978.
Milgram’s Folders
Stanley Milgram, then at Harvard and already known for his obedience experiments, tested the question with the mail. Each starter received a folder describing a target person and the rule: if you know the target personally, send it to them; otherwise send it to a first-name acquaintance more likely to know them, and mail a tracer postcard back to Harvard. The first published account appeared in the May 1967 issue of Psychology Today, and it led with its best story: a folder from Kansas that reached the wife of a divinity student in Cambridge, Massachusetts, in four days, through two intermediaries.
The full study, by Jeffrey Travers and Milgram, appeared in Sociometry in December 1969. It had 296 starters: 196 in Nebraska (100 of them owners of blue-chip stock, the rest from a mailing list) and 100 in the Boston area. The target was a stockbroker who worked in Boston and lived in Sharon, Massachusetts. Sixty-four chains reached him. Among those, the mean number of intermediaries was 5.2. Milgram also noticed how the chains converged: in one variant 16 of 24 completed folders reached the target through the same man, a clothing merchant he called “Mr. Jacobs”. The phrase “six degrees of separation” is not Milgram’s. It comes from the title of John Guare’s 1990 play.
Myth: Milgram proved that everyone is six handshakes from everyone else
Most of Milgram’s chains never arrived. In the published study 64 of 296 folders reached the target, and the starters were not a random sample: a third were stockholders writing to a stockbroker, and a third lived near him. In 2002 the psychologist Judith Kleinfeld reported what she found in Milgram’s papers at Yale: an unpublished first study in Wichita in which 3 of 60 folders (5 percent) reached the divinity student’s wife, after passing through about eight people. The four-day anecdote in Psychology Today was accurate and unrepresentative. Short chains exist; Milgram’s data showed that some people could find them, not that everyone is linked in six steps. See Myths and Misconceptions.
The experiment was repeated at scale, and published in 2003, by Peter Sheridan Dodds, Roby Muhamad, and Duncan Watts at Columbia, by email. Of 98,847 people who registered, about a quarter started chains toward one of 18 targets in 13 countries, among them an archival inspector in Estonia and a policeman in Australia. Only 384 of 24,163 chains reached their targets. The completed ones averaged 4.05 steps; correcting for the chains that died, the authors estimated a median of five to seven. They found that the senders mostly used medium and weak ties, work colleagues more than family, and concluded that attrition came from lack of interest, not lack of a path.
Weak Ties
In 1973 the sociologist Mark Granovetter published “The Strength of Weak Ties” in the American Journal of Sociology. He had surveyed 282 professional, technical, and managerial workers in Newton, Massachusetts, who had recently changed jobs. Of those who found the job through a personal contact, 16.7 percent saw that contact often; the rest saw them only occasionally or rarely. His explanation was structural. Close friends tend to know each other and to know the same things; an acquaintance is a bridge into a different cluster, where the news is new. The paper became one of the most cited in the social sciences. It also stated the puzzle that network science later solved: a world made of tight clusters should be large, yet the chains were short.
Cliques with Shortcuts
Duncan Watts was a graduate student at Cornell studying how crickets synchronize their chirping, with the applied mathematician Steven Strogatz as his adviser, when he started asking which network the crickets listened on. Their paper “Collective dynamics of ‘small-world’ networks” appeared in Nature on 4 June 1998.
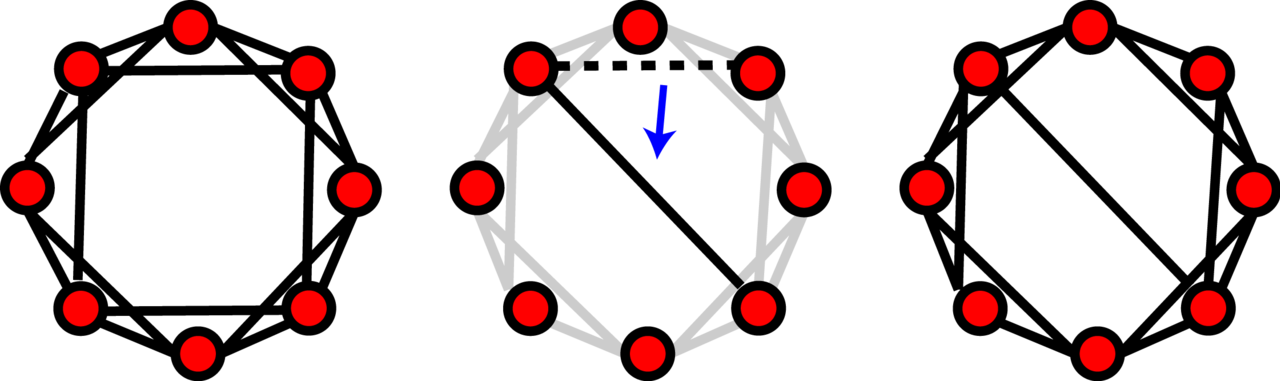
It fit on three pages. Start with a ring in which each node is linked to its nearest neighbors: highly clustered (your neighbors know each other) and large (a message crawls around the ring). Now take each link and, with a small probability, rewire it to a random node anywhere on the ring. Watts and Strogatz measured two numbers as the probability rose: the clustering coefficient and the average path length. Path length collapsed after only a handful of rewirings, because each random link is a shortcut for everyone near its ends. Clustering barely moved. For a wide range in between, the network was cliquish like a lattice and small like a random graph. They called such networks small worlds.
Then they checked three real networks for which complete data existed: the film actors in the Internet Movie Database, linked by appearing in the same film; the western United States power grid; and the 282-neuron nervous system of the worm C. elegans. All three were small worlds. The paper also showed that an infection spread far faster on a small world than on a lattice. Granovetter’s weak ties were the rewired edges.
Hubs
Albert-László Barabási, a physicist at the University of Notre Dame, set a crawler loose on the Notre Dame website with his student Réka Albert and postdoc Hawoong Jeong. Their one-page letter “Diameter of the World-Wide Web” appeared in Nature on 9 September 1999. The counts of links per page did not follow the Poisson curve of the Erdős-Rényi graph. They followed a power law: most pages had a few links, and a few pages had enormous numbers. Extrapolating to the estimated 800 million documents on the web, they calculated that two random pages were on average 18.59 clicks apart, “i.e., two randomly chosen documents on the web are on average 19 clicks away from each other,” and that a tenfold growth of the web would raise this only to 21.
A month later, in Science of 15 October 1999, Barabási and Albert proposed a cause. In “Emergence of scaling in random networks” a network grows by adding nodes, and each newcomer links to existing nodes with probability proportional to how many links they already have. The rich get richer, and the result is a power-law distribution with exponent 3, independent of the network’s size. Networks without a characteristic number of links were named scale-free, and their best-connected nodes hubs. Hubs had consequences. In 2000 Albert, Jeong, and Barabási showed that a scale-free network survives the random failure of many nodes but falls apart quickly when its hubs are removed on purpose, and they applied the result to the Internet, whose router graph the Faloutsos brothers had reported in 1999 to follow power laws.
The mechanism had been found before. The statistician George Udny Yule used it for the number of species per genus in 1925, Herbert Simon for word frequencies and city sizes in 1955, and the historian of science Derek de Solla Price, who had observed in 1965 that citations to scientific papers follow a power law, called it “cumulative advantage” in 1976. Barabási’s contribution was to show it on the network everyone was then building.
The web’s structure was more complicated than one number. In 2000 Andrei Broder and colleagues at AltaVista, IBM, and Compaq analysed two crawls of more than 200 million pages and 1.5 billion links and found a “bow tie”: a strongly connected core of about 56 million pages, an “in” set that could reach it, an “out” set reachable from it, and tendrils attached to neither. For a random pair of pages, a directed path from one to the other existed only 24 percent of the time; when it did, it averaged about 16 links.
The Graph as Product
By the time network science had a name, the companies it described were building on the same ideas. Google’s PageRank (1998) ranks a page by the links pointing at it, weighted by the rank of their sources: a formalization of hubs and authority. Social networking sites made the acquaintance graph explicit, and Facebook, which held the largest one, measured Milgram’s quantity directly. In 2011 Lars Backstrom and colleagues at Facebook and the University of Milan computed the distances between all 721 million active users, connected by 69 billion friendships. The average distance was 4.74 links, which they described as “3.74 ‘degrees of separation’”. A Facebook recomputation in 2016 put the figure at 3.57 degrees. The Erdős number (see Fun Fact: The Erdős Number) and the game Six Degrees of Kevin Bacon are the same measurement on collaboration graphs.
The measurement is not the same as Milgram’s. A computed shortest path uses the full graph; Milgram’s senders knew only their own friends and had to guess. In 2000 Jon Kleinberg at Cornell showed that this makes a difference: in most small-world models short paths exist but no local rule can find them, and they become findable only when long-range links follow a particular distribution over distance. That people did find short chains says something about how acquaintances are spread across geography and occupation.
⚠️ Dead End: Scale-Free Everywhere
For a decade after 1999, power laws were reported in protein interactions, metabolic pathways, airline routes, sexual contacts, citation graphs, software dependency graphs, and the Internet itself, often by plotting the degree distribution on logarithmic axes and fitting a straight line. The papers suggested a universal law: networks of all kinds grow by preferential attachment and share one architecture.
The method was weak. A straight segment on a log-log plot is consistent with several other heavy-tailed distributions, and a least-squares line through a histogram gives biased exponents. In 2009 Aaron Clauset, Cosma Shalizi, and Mark Newman published a statistical procedure for testing power laws against alternatives. For the Internet specifically, Walter Willinger, David Alderson, and John Doyle argued in a series of papers from 2004 to 2009 that the router graph’s apparent hubs were partly an artifact of how traceroute data was collected, and that real backbone routers cannot carry thousands of links because of hardware limits.
In March 2019 Anna Broido and Aaron Clauset published “Scale-free networks are rare” in Nature Communications. They applied the tests to 927 networks from biology, technology, society, transport, and information. About 4 percent met the strongest definition of scale-free; close to half did not meet even the weakest. Log-normal distributions fit most networks as well as power laws or better. Social networks were at best weakly scale-free. “Most networks don’t look scale-free at all,” Clauset said. The same issue carried a response from Petter Holme titled “Rare and everywhere”, arguing that the concept remained useful as an idealization. The debate did not undo the field’s other results: small-world structure, heavy tails, hubs, and the fragility they cause are all measurable. What did not survive was the claim that one growth rule explains most of the world’s networks.
📚 Sources
- Karinthy, Frigyes: “Chain-Links” (1929), English translation by Adam Makkai and Enikő Jankó
- Erdős–Rényi model — Wikipedia (1959 papers, Gilbert, 1960 giant component)
- Small-world experiment — Wikipedia (Pool and Kochen, Milgram 1967, “Mr. Jacobs”, Guare, Facebook 2016)
- Travers, Jeffrey & Milgram, Stanley: “An Experimental Study of the Small World Problem,” Sociometry 32(4), 425–443 (December 1969)
- Kleinfeld, Judith S.: “Could It Be a Big World After All? The ‘Six Degrees of Separation’ Myth,” Society (2002) (the Wichita study, starter groups, Yale archive)
- Dodds, Peter Sheridan; Muhamad, Roby & Watts, Duncan J.: “An Experimental Study of Search in Global Social Networks,” Science 301, 827–829 (8 August 2003)
- Mark Granovetter — Wikipedia (“The Strength of Weak Ties,” 1973)
- Watts, Duncan J. & Strogatz, Steven H.: “Collective dynamics of ‘small-world’ networks,” Nature 393, 440–442 (1998)
- Watts–Strogatz model — Wikipedia
- Albert, Réka; Jeong, Hawoong & Barabási, Albert-László: “Diameter of the World-Wide Web,” Nature 401, 130–131 (9 September 1999), arXiv:cond-mat/9907038
- Barabási, Albert-László & Albert, Réka: “Emergence of scaling in random networks,” Science 286, 509–512 (1999), arXiv:cond-mat/9910332
- Barabási–Albert model — Wikipedia (Yule, Simon, Price’s cumulative advantage)
- Scale-free network — Wikipedia (Price 1965, Faloutsos 1999, critiques)
- Broder, Andrei et al.: “Graph structure in the Web,” Computer Networks 33, 309–320 (2000)
- Backstrom, Lars; Boldi, Paolo; Rosa, Marco; Ugander, Johan & Vigna, Sebastiano: “Four Degrees of Separation,” WebSci 2012, arXiv:1111.4570
- Albert, Réka; Jeong, Hawoong & Barabási, Albert-László: “Error and attack tolerance of complex networks,” Nature 406, 378–382 (2000)
- Kleinberg, Jon: “Navigation in a small world,” Nature 406, 845 (2000)
- Clauset, Aaron; Shalizi, Cosma Rohilla & Newman, M. E. J.: “Power-law distributions in empirical data,” SIAM Review 51, 661–703 (2009), arXiv:0706.1062
- Willinger, Walter; Alderson, David & Doyle, John C.: “Mathematics and the Internet: A Source of Enormous Confusion and Great Potential,” Notices of the AMS 56(5), 586–599 (2009)
- Granovetter, Mark: “The Strength of Weak Ties,” American Journal of Sociology 78(6), 1360–1380 (1973) (Newton sample, contact frequencies)
- Yule, G. Udny: “A Mathematical Theory of Evolution, based on the Conclusions of Dr. J. C. Willis, F.R.S.,” Philosophical Transactions of the Royal Society B 213 (1925)
- Broido, Anna D. & Clauset, Aaron: “Scale-free networks are rare,” Nature Communications 10, 1017 (2019)
- “Do all networks obey the scale-free law? Maybe not,” ScienceDaily (4 March 2019) (the 4 percent figure, Clauset quote)
- Holme, Petter: “Rare and everywhere: Perspectives on scale-free networks,” Nature Communications 10, 1016 (2019)
- Image: Watts-Strogatz-rewire.png by Jmcatania (CC BY-SA 3.0), via Wikimedia Commons